HF Dashboard
Australia Bureau of Meterology Data
The charts and information below are Copyright of the Australian Bureau of Meterology.
For amateur radio use only: not for navigation or commercial use.

- High Latitude Conditions
- Global Propagation Summary
- Digital HF Prediction Tool
- ASWFC Ionogram Viewer
- Ionospheric Summary and Forecast
- HF Systems Index
Real-time foF2 observation map
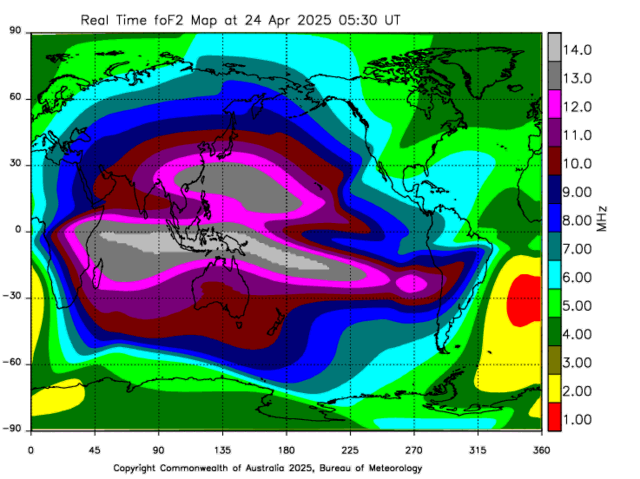
This map can be used as a guide to NVIS ionospheric frequency support. For longer paths (over 1500km) use the Digital HF Prediction Tool.
foF2 Anomaly Map
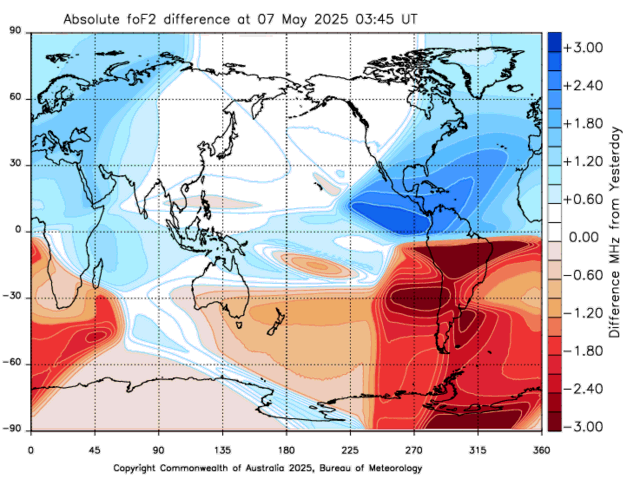
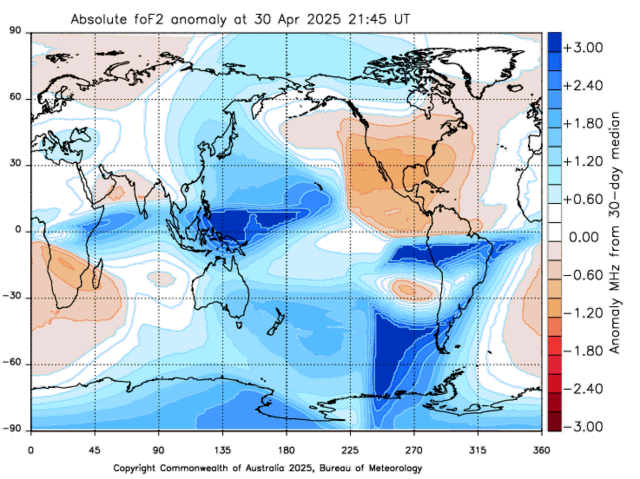
The plots above shows a near real-time relative foF2 difference. The geomagnetic field splits a radio wave in the ionosphere into two separate components, termed the ordinary (o) and extraordinary (x) waves. It is the o-wave which is routinely scaled from ionograms because it is the refracted component of the incident signal, with an angle of reflection equal to the incident angle at zenith about the virtual height.
Real-time T Index Map
T-Index FAQ: https://www.sws.bom.gov.au/Educational/5/2/1

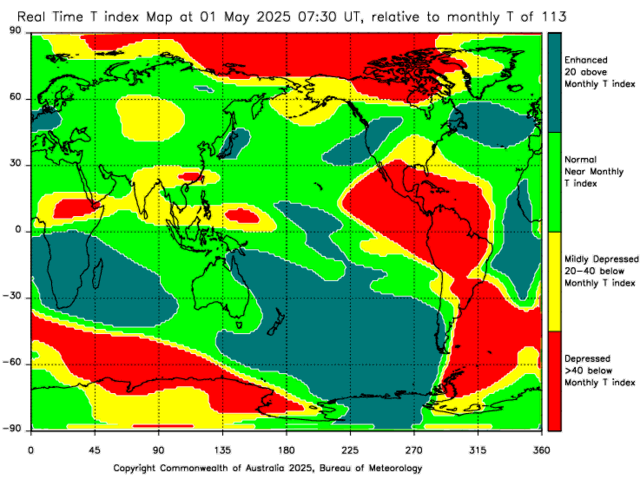
The maps above show the difference between current observed hourly conditions and predicted monthly conditions. Depressions and enhancements are with respect to the Australian BoM SWS predicted monthly T index for that month.
Hourly Area Prediction (HAP) Maps
The HAP chart is a guide to frequency selection for HF communications between mobiles and a specified base station. The recommended frequency for communications with the base at a given hour is read off from the point in the map corresponding to the mobile's location. The predictions are made from real time data which are updated each hour.
Hourly Local Area Mobile Predictions (LAMP)
Local Area Mobile Predictions or LAMPs are designed for communications between a base and a mobile. There is no geographical information on the charts as there is only one ionospheric control point restricting the mobile to being within 1000 km of the base. The charts can also be used for communications between two mobiles that are both within 300 km of the base (use the distance between the two mobiles when reading the recommended frequency from the charts).
The data is derived by automated interpretation of hourly regional ionograms. The charts display a three to seven hour coloured band that moves down the the chart window in the course of a day, returning to the top around the start of the day. This band gives observed communication frequencies and a prediction for the next period. All times are Universal Coordinated Time (UTC).
Near-real-time ionospheric VTEC (vertical Total Electron Content)

Vertical Total Electron Content (VTEC) and the range error (in metres) for GPS L1 signals (1575.42 MHz). One TEC unit (TECU) equals 1016 electrons/m2. The GPS L1 range error is directly proportional to the amount of TEC along the signal's path.
HF Fadeout Map
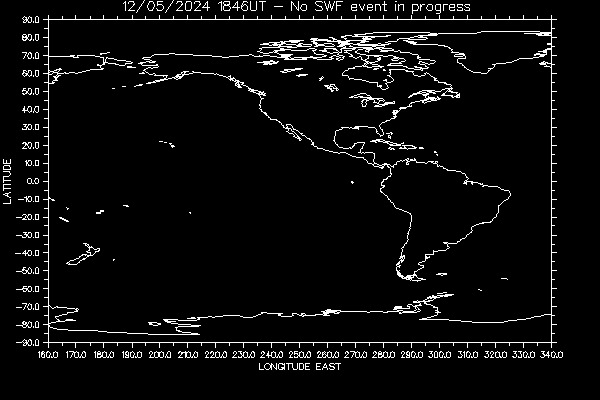
During a solar flare, increased ionisation in the D-layer of the ionosphere can result in reduced signal strengths for HF circuits which are reflected by the ionosphere on the sunlit hemisphere of the earth. This is known as a short-wave fadeout.
Last Major Flare
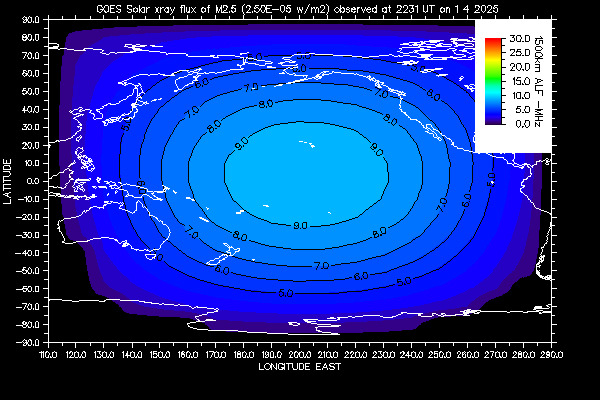
The maps above show the absorption limited frequency (ALF) - the lowest frequency able to propagate - for HF circuits typically 1500 km in length. Disturbances may last days from the last observed date indicated.
Current foF2 Plots
These are graphs of autoscaled foF2 against monthly predicted foF2 values. These values are based on the automated interpretation of ionograms received each hour.
Polar Cap Absorbtion (PCA) Charts
A polar cap absorption event results from the ionisation of the D-layer of the polar ionosphere by high energy protons. A PCA causes a HF radio blackout for trans polar circuits and can last several days.